Image Details
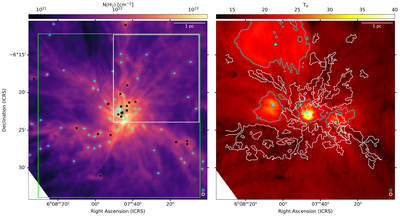
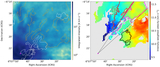
Caption: Figure 5.
H2 column density (left) and dust temperature (right) maps obtained from Herschel data (P. Didelon et al. 2015; M. S. N. Kumar et al. 2022). The green box in the left panel indicates the observed region using the Nobeyama 45 m telescope. The white box in the left panel shows the same area shown in Figure 1. The black stars and cyan crosses in the left panel indicate the prestellar and protostellar cores defined and analyzed in T. S. M. Rayner et al. (2017). The cyan contours in the right panel correspond to a dust temperature of 21 K. The cyan crosses present the positions of heating sources of HII regions (P. Didelon et al. 2015). The white contours indicate the velocity-coherent components of C18O emission, as shown in the left panel of Figure 6. Scale bars are located at the top right corners of both panels. The cyan and white circles at the bottom right corners of both panels indicate the effective beam sizes of 21﹩\mathop{.}\limits^{\unicode{x02033}}﹩8 and 18″ for the Nobeyama 45 m telescope and the Herschel observations, respectively.
An interactive version of this figure is available in the online article.
An interactive version of this figure is available.
An interactive version of this figure is available in the online journal.
Other Images in This Article
Copyright and Terms & Conditions
© 2026. The Author(s). Published by the American Astronomical Society.