Image Details
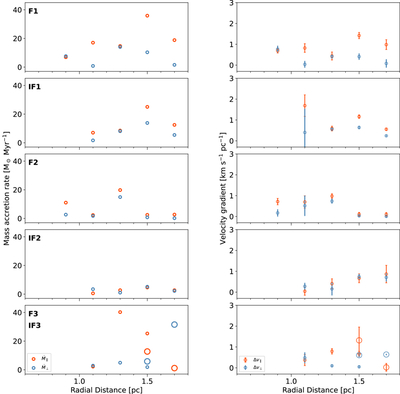
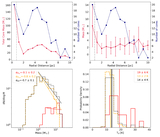
Caption: Figure 9.
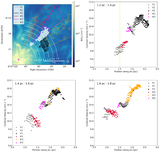
Mass accretion rates (﹩\dot{M}﹩; left) and velocity gradients (Δv; right) along (∥) and across (⊥) the Fs and IFs, measured in 0.2 pc steps (within the arcs shown in Figure 8) from the hub center. The red open circles in the left and right panels indicate ﹩{\dot{M}}_{\parallel }﹩ and Δv∥, respectively. The blue dots in the left and right panels indicate ﹩{\dot{M}}_{\perp }﹩ and Δv⊥, respectively. The error bars in the right panel are the fitting errors. In the last row, we overplot the values of F3 and IF3, as they are identified as a continuous structure radially extending away from the hub. The larger circles indicate values in IF3.
Other Images in This Article
Copyright and Terms & Conditions
© 2026. The Author(s). Published by the American Astronomical Society.