Image Details
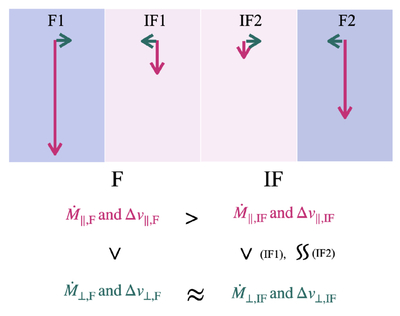
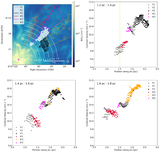
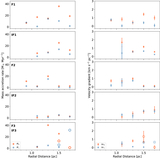
Caption: Figure 3.
Summary results of the relative mass accretion rates and velocity gradients along and across the Fs and IFs. The top four boxes indicate each structure. The green and magenta arrows indicate the relative velocity gradients along and across the structure. The lengths of the arrows indicate the relative scale, based on the mean ratio listed in Table 1. The bottom chart summarizes the inequality of the mass accretion rates and velocity gradients across and along the Fs and IFs, based on the values in Columns (9) and (10) of Table 1.
Other Images in This Article
Copyright and Terms & Conditions
© 2026. The Author(s). Published by the American Astronomical Society.
Copyright ©
2026 Astronomy Image Explorer. All Rights Reserved.