Image Details
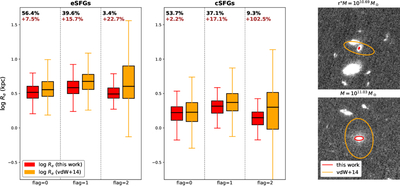
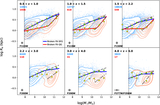
Caption: Figure B1.
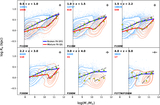
Comparison between galaxy size measurements derived from HST and JWST imaging. Left: size distributions of eSFGs. Red and orange box plots show measurements from this work and from A. van der Wel et al. (2014), respectively. Vertical grid lines indicate different fitting-quality flags defined in A. van der Wel et al. (2014). Each box shows the median (horizontal line), interquartile range (IQR; box edges), and the maximum/minimum within 1.5 × IQR (whiskers). Outliers beyond this range are excluded for clarity. Black numbers indicate the fraction of galaxies, with each flag relative to the total sample. Red numbers show the percentage by which the median size from A. van der Wel et al. (2014) exceeds the median size measured in this work. Middle: same as the left panel, but for cSFGs. Right: examples of individual galaxies, showing size measurements from both HST and JWST images. Orange ellipses represent the effective isophotal fits from A. van der Wel et al. (2014), and red ellipses show results from our own fitting.
Other Images in This Article
Show More
Copyright and Terms & Conditions
© 2026. The Author(s). Published by the American Astronomical Society.