Image Details
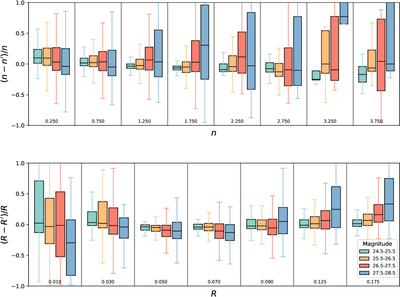
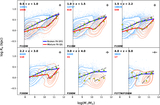
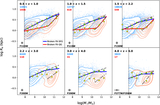
Caption: Figure A1.
Top: the relative deviation of the estimated Sérsic index (﹩{n}^{{\prime} }﹩) from the true Sérsic index (n) as a function of ﹩{n}^{{\prime} }﹩, defined as ﹩(n-{n}^{{\prime} })/n﹩. The vertical grid lines separate ﹩{n}^{{\prime} }﹩ bins. Boxes show median (central horizontal line), interquartile range (IQR; box edges), and the maximum/minimum within 1.5 × IQR (whiskers). Bottom: the relative deviation of the estimated ﹩{R}^{{\prime} }﹩ from the true R as a function of ﹩{R}^{{\prime} }﹩, defined as ﹩(R-{R}^{{\prime} })/R﹩. Outliers beyond 1.5 × IQR (∼1.5%) are excluded for clarity in all plots.
Other Images in This Article
Show More
Copyright and Terms & Conditions
© 2026. The Author(s). Published by the American Astronomical Society.