

Image Details
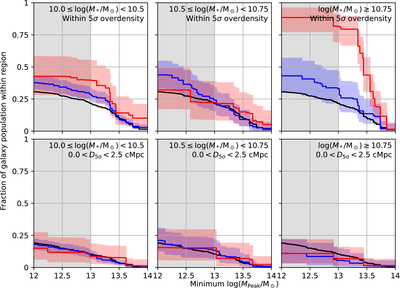
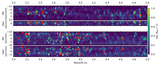
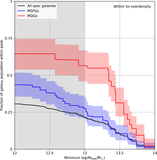
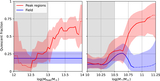
Caption: Figure 9.
Same as Figure 8, but splitting MQGs and MSFGs into different stellar mass bins (low to high, left to right) and different regions (top to bottom, inside overdense peak versus immediately nearby overdense peak). The black line representing all spectroscopically confirmed galaxies is uniform across the mass bins. At lower stellar masses, the clustering of MQGs and MSFGs is indistinguishable from the overall spectroscopic sample; at higher stellar masses, however, MQGs appear to cluster much more strongly in overdense peaks.
Other Images in This Article
Show More
Copyright and Terms & Conditions
© 2026. The Author(s). Published by the American Astronomical Society.

Copyright ©
2026 Astronomy Image Explorer. All Rights Reserved.
