

Image Details
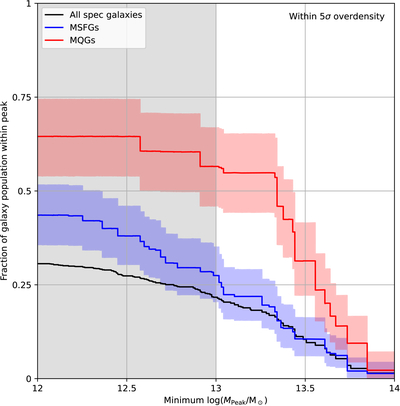
Caption: Figure 8.
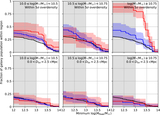
The fractions of spectroscopically confirmed galaxy subpopulations identified within overdense peaks above a minimum Mpeak. As one moves right along the x-axis, the number of overdense peaks above the minimum ﹩\mathrm{log}({M}_{\mathrm{Peak}}/{M}_{\odot })﹩ declines, and therefore the fractions of galaxies within these peaks also decline. We show MQGs (red), MSFGs (blue), and the overall spectroscopic sample (black). Not only are a higher fraction of MQGs found within overdense peaks than any other subpopulation, ∼50% also are found primarily in robustly detected ﹩\mathrm{log}({M}_{\mathrm{Peak}}/{M}_{\odot })\,\geqslant \,13﹩ overdense peaks. We show all peaks down to ﹩\mathrm{log}({M}_{\mathrm{Peak}}/{M}_{\odot })=12﹩, though the peaks in the shaded region ﹩12\,\leqslant \,\mathrm{log}({M}_{\mathrm{Peak}}/{M}_{\odot })\lt 13﹩ tend to be physically smaller, with fewer spectroscopically confirmed galaxies, and typically have lower median and maximum density.
Other Images in This Article
Show More
Copyright and Terms & Conditions
© 2026. The Author(s). Published by the American Astronomical Society.

