

Image Details
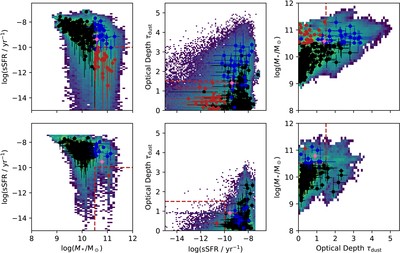
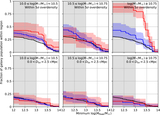
Caption: Figure 3.
Top left: a two-dimensional histogram of ﹩\mathrm{log}({M}_{* }/{M}_{\odot })﹩ and ﹩\mathrm{log}({\rm{sSFR}}/{{\rm{yr}}}^{-1})﹩ from the posterior draws of all mF444W < 24 spectroscopically confirmed galaxies modeled with Prospector. The individual galaxies and their uncertainties are indicated by black/blue/red/pink for galaxies classified as ﹩\mathrm{log}({M}_{* }/{M}_{\odot })\lt 10.5﹩/﹩\mathrm{log}({M}_{* }/{M}_{\odot })\,\geqslant \,10.5﹩ star-forming/﹩\mathrm{log}({M}_{* }/{M}_{\odot })\,\geqslant \,10.5﹩ quiescent/﹩\mathrm{log}({M}_{* }/{M}_{\odot })\,\geqslant \,10.5﹩ marginally quiescent based on their inferred posterior medians. The red box denotes the region we use to define MQGs. Top middle: same as the left, but for ﹩\mathrm{log}({\rm{sSFR}}/{{\rm{yr}}}^{-1})﹩ and optical depth τdust. Galaxies with high τdust and low sSFR appear to be dusty star-forming galaxies based on visual inspection of their spectra and SEDs. Top right: same as the left, but for ﹩\mathrm{log}({M}_{* }/{M}_{\odot })﹩ and dust optical depth τdust. Bottom row: the same layout as the top row, except showing the inferred properties from galaxies with only fits to photometry at zspec in Section 3.3.
Other Images in This Article
Show More
Copyright and Terms & Conditions
© 2026. The Author(s). Published by the American Astronomical Society.

