

Image Details
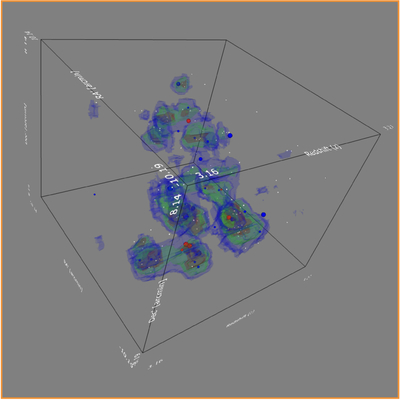
Caption: Figure 6.
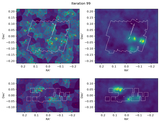
An isometric view of UDS-PCl-z3.2 from the MCVT mapping. We show 3σ/5σ/8σ contours as blue/green/red surfaces. Galaxies with ﹩\mathrm{log}({M}_{* }/{M}_{\odot })\,\geqslant \,10.5﹩ are shown as large colored spheres (red for quiescent, blue for star-forming), ﹩10\,\leqslant \,\mathrm{log}({M}_{* }/{M}_{\odot })\lt 10.5﹩ as smaller colored spheres, and all other spectroscopically confirmed galaxies as small white spheres. An interactive version of this figure is available in the online journal via the X3D-pathway (F. P. A. Vogt et al. 2016) for exploration (click and drag to rotate, scroll to zoom). In the interactive version, all protoclusters in Table 3 plus UDS-Peak-z4.6 are viewable via a dropdown menu and quiescent galaxies are labeled according to their IDs in Tables 1 and A1. Buttons are provided to align the viewer along the R.A﹩\mathop{.}\limits^{\unicode{x02032}}﹩ decl. ′ z axes and to toggle the contours and quiescent galaxy labels on or off.
An interactive version of this figure is available in the online article.
An interactive version of this figure is available.
An interactive version of this figure is available in the online journal.
Other Images in This Article
Show More
Copyright and Terms & Conditions
© 2026. The Author(s). Published by the American Astronomical Society.

