

Image Details
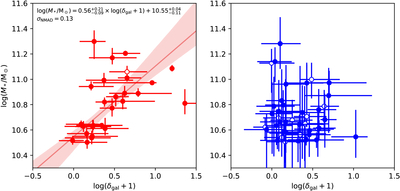
Caption: Figure 7.
Left: stellar mass as a function of ﹩\mathrm{log}({\delta }_{{\rm{gal}}}+1)﹩ for MQGs (open circles correspond to properties inferred from modeling just photometry). The red line shows the best-fit line to the MQG population using orthogonal distance regression, and the semitransparent bands show the 1σ confidence limits. The best-fit line and the scatter σNMAD are shown in the top of the panel. Right: same as the left panel, but for the MSFG population. We do not fit a line to the MSFG population due to its higher uncertainties on ﹩\mathrm{log}({M}_{* }/{M}_{\odot })﹩, though we do note that there seems to be a visually flat or negative relation between stellar mass and local overdensity.
Other Images in This Article
Show More
Copyright and Terms & Conditions
© 2026. The Author(s). Published by the American Astronomical Society.

