

Image Details
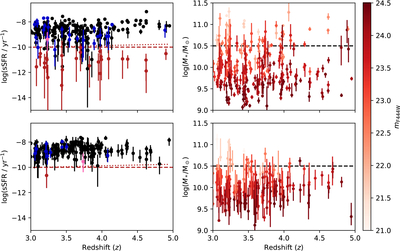
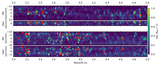
Caption: Figure 2.
Top left: specific star formation rate versus redshift for spectroscopically confirmed galaxies modeled with Prospector. The dashed red line indicates the ﹩\mathrm{log}({\rm{sSFR}}/{{\rm{yr}}}^{-1})\lt -10﹩ selection we use in this work, and the dotted red line shows the alternative sSFR < 0.2 yr−1 selection. Our results are robust to the choice in sSFR cut. The top histogram shows the nonnormalized distribution of redshifts of all galaxies (black), MSFGs (blue), and MQGs. The few pink points show massive marginally quiescent galaxies (﹩\mathrm{log}\,({\mathrm{sSFR}}_{16}/{\mathrm{yr}}^{-1})\lt -10﹩). Top right: stellar mass versus redshift for the same galaxies in the left panel, with points colored by F444W magnitude to demonstrate the mass-completeness limit selected. Bottom row: the same schematic as the top row, except for the set of galaxies for which only photometry was modeled at zspec.
Other Images in This Article
Show More
Copyright and Terms & Conditions
© 2026. The Author(s). Published by the American Astronomical Society.

