

Image Details
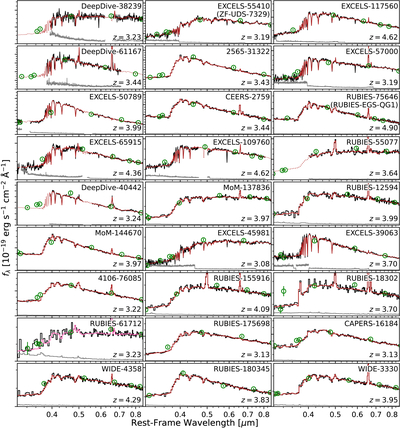
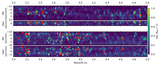
Caption: Figure 1.
The 26 spectroscopically confirmed ﹩\mathrm{log}({M}_{* }/{M}_{\odot })\,\geqslant \,10.5﹩ quiescent galaxies with JWST spectroscopy that form our sample (and one marginally quiescent galaxy). Galaxies are shown in order of descending inferred stellar mass, left to right, top to bottom. In each panel, the NIRSpec spectrum and uncertainty are shown in black and gray with the MAP Prospector model spectrum overlaid in red (pink for the marginally quiescent galaxy). For visibility, we smooth the medium-resolution grating spectra and their models with a Gaussian filter. Green open circles with error bars show the photometry. To scale the observed, error, and model spectra to the observed photometry, the inverted calibration vector is applied. Each major (minor) tick along the vertical axis is (0.25 × )10−19 erg s−1cm−2 Å−1. In each panel, we give the spectrum ID and redshift (for other properties, see Table 1). Distinct sources with different names in the literature (e.g., K. Glazebrook et al. 2024; A. de Graaff et al. 2025a) have these names given in parentheses; we use them hereafter.
Other Images in This Article
Show More
Copyright and Terms & Conditions
© 2026. The Author(s). Published by the American Astronomical Society.

