

Image Details
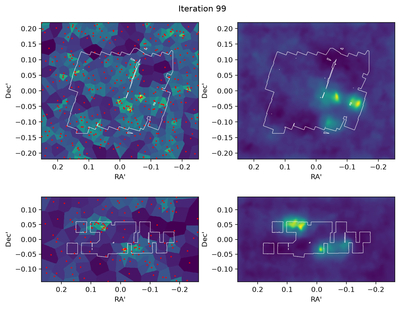
Caption: Figure 4.
The MCVT process at z = 3.193 in the UDS (top) and z = 4.891 in the EGS (bottom). The left panels show the final single iteration of the MCVT process. Red points are the coordinates of galaxies that fall into the redshift slice in the given iteration. Each cell is colored according to the inverse of its area. Panels on the right show the stacked medians of all 100 iterations, smoothed by a Gaussian filter with a width of 2.5 pixels. In both panels the white contour shows the outline for the F444W footprints and the color density scaling is left arbitrary. The fields are shown in the R.A.﹩{}^{{\prime} }﹩ and decl.﹩{}^{{\prime} }﹩ coordinate frame. An animated version showing the construction of the median image for all 100 iterations is available in the online journal. The real-time duration of the animation is 15 s.
(An animation of this figure is available in the online article.)
(An animation of this figure is available.)
The video/animation of this figure is available in the online journal.
Other Images in This Article
Show More
Copyright and Terms & Conditions
© 2026. The Author(s). Published by the American Astronomical Society.

