

Image Details
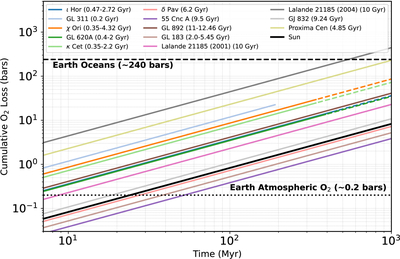
Caption: Figure 8.
Cumulative oxygen loss for planets at the HZ of each sample star over 1 Gyr, assuming constant stellar XUV flux at the HZ and no replenishment of oxygen. The curves are calculated using the energy-limited O2 loss prescription from V. S. Airapetian et al. (2017). Colored lines show individual stars, with solid segments representing the earliest ages (for stars with age ranges) and dashed segments extending beyond the minimum age. The black solid line shows the solar reference. Horizontal lines indicate the present-day Earth atmospheric O2 content (∼0.2 bars; dotted) and the total mass of Earth’s oceans (∼240 bars; dashed), providing reference levels for planetary habitability.
Other Images in This Article
Copyright and Terms & Conditions
© 2026. The Author(s). Published by the American Astronomical Society.

