

Image Details
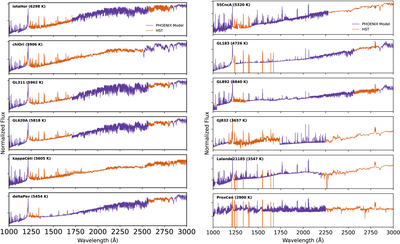
Caption: Figure 2.
UV spectra of the sample stars, ordered by effective temperature. The HST observations adopted for the final SEDs are shown in orange, while the corresponding PHOENIX model spectra are shown in purple. The models provide wavelength coverage where observations are unavailable, including the unobservable EUV region and wavelengths longer than the NUV HST spectra. For GL 183, Lalande 21185, and Proxima Centauri, FUV emission lines are displayed with extended baselines below the continuum to aid visualization; the final SED product instead smoothly merges these features with the surrounding continuum.
Other Images in This Article
Copyright and Terms & Conditions
© 2026. The Author(s). Published by the American Astronomical Society.

Copyright ©
2026 Astronomy Image Explorer. All Rights Reserved.
