

Image Details
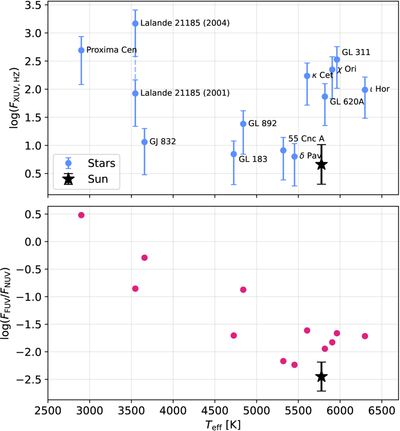
Caption: Figure 5.
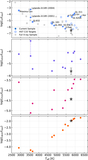
High-energy radiation environments of the sample stars as a function of effective temperature. The top panel shows the XUV flux (log(FXUV)) within the HZ, while the bottom panel shows the ratio of FUV to NUV flux (log(FFUV/NUV)). The Sun is shown as a black star for reference. Vertical error bars on the sample stars indicate the range of fluxes between the inner and outer HZ boundaries and do not represent measurement uncertainties, while the solar error bars reflect both the HZ width and the range of solar emission across the activity cycle. Consistent with Figure 4, most stars in the sample exhibit HZ XUV fluxes approximately 1–2 orders of magnitude higher than those experienced by the Earth, and the FUV to NUV flux ratio of solar-temperature stars is slightly elevated relative to solar values, with even more relatively stronger FUV emission seen toward later spectral types.
Other Images in This Article
Copyright and Terms & Conditions
© 2026. The Author(s). Published by the American Astronomical Society.

