

Image Details
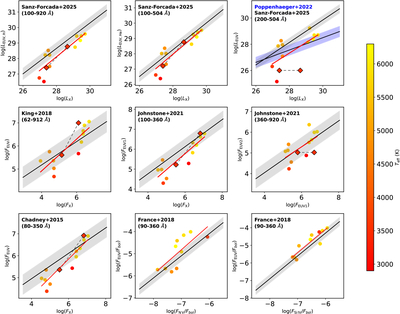
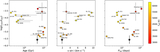
Caption: Figure 6.
Comparison of EUV fluxes derived from the panchromatic SEDs to predictions from empirical scaling relationships. Panel labels indicate the wavelength ranges used for each scaling relationship. Each panel shows integrated EUV fluxes or luminosities from this work (points, color coded by effective temperature) compared to the published relations, shown as black lines, with gray shaded regions indicating the approximate rms scatter reported for each relationship. Diamond symbols connected by a dashed line are the values from the two Lalande 21185 SEDs with APEC models constructed from 2001 and 2004 observations. Red lines show linear fits to the SED-derived values. In the top right panel, both the J. Sanz-Forcada et al. (2025) relation (black) and the earlier K. Poppenhaeger (2022) relation (blue) are shown, as both predict EUV emission over the same wavelength range. A detailed numerical comparison between the EUV fluxes derived from our SEDs and those predicted by the scaling relations is provided in Appendix Table A1.
Other Images in This Article
Copyright and Terms & Conditions
© 2026. The Author(s). Published by the American Astronomical Society.

