

Image Details
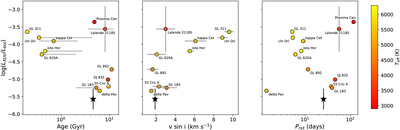
Caption: Figure 7.
Stellar high-energy activity, expressed as ﹩\mathrm{log}({L}_{{\rm{XUV}}}/{L}_{{\rm{bol}}})﹩, plotted against stellar age (left), projected rotational velocity (center), and rotation period (right) (values given in Table 2). Symbols are colored by effective temperature. Vertical error bars show the range of XUV luminosities derived from multiple epochs for Lalande 21185 and the Sun, reflecting activity variability, while horizontal error bars denote uncertainties in ﹩v\,\sin \,i﹩. The Sun is plotted as a black star for comparison.
Other Images in This Article
Copyright and Terms & Conditions
© 2026. The Author(s). Published by the American Astronomical Society.

Copyright ©
2026 Astronomy Image Explorer. All Rights Reserved.
