

Image Details
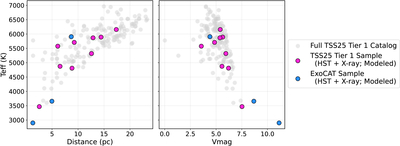
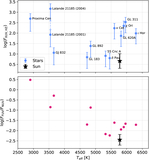
Caption: Figure 1.
Demographic comparison of our modeled stellar samples with the full TSS25 Tier 1 catalog. Gray points show all Tier 1 stars, while colored symbols highlight the subsets with both HST and X-ray observations that are included in our modeling sample. Magenta points denote stars drawn from the TSS25 Tier 1 list, and blue points denote additional stars from the ExoCAT database with comparable observations. Left: stellar effective temperature versus distance. Right: effective temperature versus apparent V-band magnitude.
Other Images in This Article
Copyright and Terms & Conditions
© 2026. The Author(s). Published by the American Astronomical Society.

Copyright ©
2026 Astronomy Image Explorer. All Rights Reserved.
