

Image Details
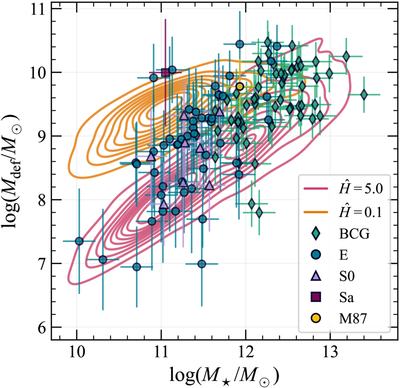
Caption: Figure 5.
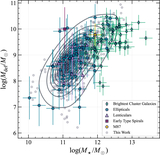
Mass deficit vs. stellar mass for our sample of core galaxies alongside KDE contours generated using a high efficiency factor (﹩\hat{H}=5.0﹩) in pink and a low efficiency factor (﹩\hat{H}=0.1﹩) in orange. The KDE contours show that the efficiency of stellar hardening is inversely proportional to the amount of stellar mass ejected, as is required by Equations (17) and (19). The figure also shows that our model is sensitive to the density of points in the Mdef–M⋆ plane. Inefficient hardening leads to a denser clustering of points at lower masses not seen at higher efficiencies. The overall slope of the trend also depends sensitively on the hardening efficiency.
Other Images in This Article
Copyright and Terms & Conditions
© 2026. The Author(s). Published by the American Astronomical Society.

