

Image Details
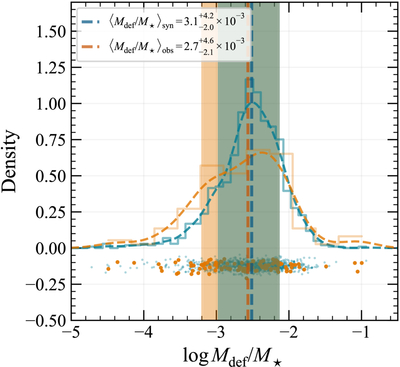
Caption: Figure 8.
Plotted are the distributions of stellar mass deficit as a fraction of total galaxy stellar mass for both the best-fit synthetic core sample (blue) and the observed ETG sample (orange). Dashed lines indicate the median values of the distributions and shaded regions show the 1σ confidence intervals. While the observed, heterogeneous sample has a broader distribution than the synthetic sample, the medians agree. These values are consistent with other measured mass deficits (A. W. Graham 2004; L. Ferrarese et al. 2006a; J. Kormendy & L. C. Ho 2013; S. P. Rusli et al. 2013; B. T. Dullo & A. W. Graham 2014) and with those found using other core scouring models (e.g., D. Merritt 2006; T. R. Lauer et al. 2007a; P. F. Hopkins et al. 2009a; F. M. Khan et al. 2012; F. Dosopoulou et al. 2021; C. J. Harris & K. Gültekin 2024).
Other Images in This Article
Copyright and Terms & Conditions
© 2026. The Author(s). Published by the American Astronomical Society.

