

Image Details
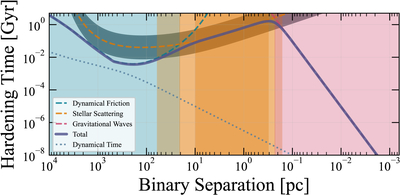
Caption: Figure 4.
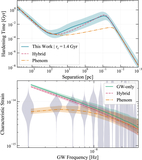
The plot shows hardening time in years on the y-axis and binary separation in parsecs on the x-axis, decreasing from left to right. The solid purple line shows the total evolutionary track for a representative binary in our model, which is a sum of the dynamical friction (blue dashed line), loss-cone scattering (orange dashed line), and GW emission (pink dashed line) hardening processes. The dotted line is the dynamical time τdyn = r/vc of the host galaxy, for reference. The dark shaded region around the loss-cone scattering curve denotes a range of possible ﹩\hat{H}﹩ values from 0.1 to 5.0. The colored shaded regions correspond to the separations where each of the three hardening mechanisms dominates. The opaque orange region shows how inefficient hardening (small values of ﹩\hat{H}﹩) leads to a smaller range of separations for which stellar scattering dominates the hardening rate, whereas efficient hardening leads to a broader range of separations, shown by the transparent orange. The boundaries of these shaded regions come from the intersection of the lower and upper bounds of the stellar-scattering curves with the dynamical friction and GW curves. Importantly, the efficiency parameter controls the separation at which GWs dominate angular momentum loss, ultimately impacting the shape of the GWB.
Other Images in This Article
Copyright and Terms & Conditions
© 2026. The Author(s). Published by the American Astronomical Society.

