

Image Details
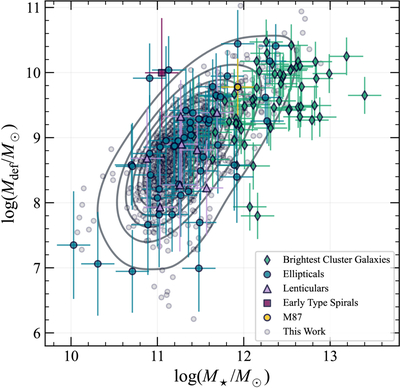
Caption: Figure 7.
The figure shows stellar mass deficit as a function of stellar mass for both the observed set of core galaxies and a sample generated using our core scouring model with ﹩\hat{H}=1.6﹩ and simulated observational uncertainties. Synthetic data points are shown in gray with the corresponding KDE and are in agreement with the observed data. We reproduce the slope and amplitude of the mass deficit–stellar mass relation.
Other Images in This Article
Copyright and Terms & Conditions
© 2026. The Author(s). Published by the American Astronomical Society.

Copyright ©
2026 Astronomy Image Explorer. All Rights Reserved.
