

Image Details
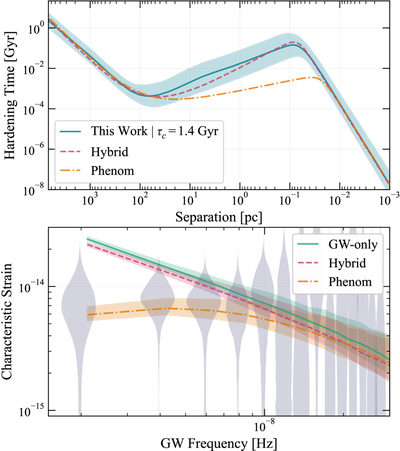
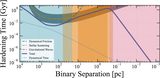
Caption: Figure 11.
Top: the plot shows the hardening timescale in gigayears vs. binary separation in parsecs. The blue evolutionary track is the median hardening time across all binaries in the best-fit model (i.e., ﹩\hat{H}=1.6﹩) with 68% confidence intervals. The orange curve shows the G. Agazie et al. (2023b) phenomenological hardening model with their best-fit parameters plus hardening by GWs, save the parameter τf , which is set to match our tc for consistency. The pink track is the phenomenological model fit to the blue track. Bottom: shown on the y-axis is the characteristic strain amplitude of the GWB, with frequency in Hz on the x-axis. The gray violins show the GW spectrum derived from the NANOGrav HD-w/MP+DP+CURN models (G. Agazie et al. 2023a; W. G. Lamb et al. 2023). The colored curves are GW spectra resulting from SBHB populations generated using holodeck. Shown in green is the spectrum expected if the hardening mechanism that drove all binaries to coalescence was GW emission alone. The orange spectrum is the G. Agazie et al. (2023b) fit to the GWB data. The pink hybrid model is comprised of the phenomenological model where the parameters in Equation (26) are set by the results of our model. Shaded regions indicate the 68% confidence intervals. The phenomenological and hybrid models are in agreement in the high frequency regime, but diverge at low frequencies. The discrepancy implies that the attenuation of the GWB at low frequencies is not caused by energy being transferred into the environment through loss-cone scattering alone.
Other Images in This Article
Copyright and Terms & Conditions
© 2026. The Author(s). Published by the American Astronomical Society.

