

Image Details
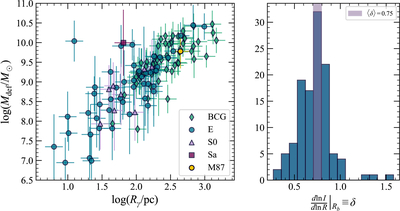
Caption: Figure 2.
Left panel: mass deficit vs. cusp radius for the observed sample of galaxies. The relation is clearly log-linear, with perhaps a weak break at the largest radii. Green diamonds show brightest cluster galaxies, blue circles indicate ellipticals, triangles indicate lenticulars, and the red square is a sole early-type spiral. For reference, M87 is represented by a yellow circle. Right panel: the distribution of logarithmic slopes δ used to compute the stellar mass deficits, with the peak located at 0.75. This agrees well with the range of 0.7–0.8 P. F. Hopkins et al. (2009b) found for progenitors of core galaxies.
Other Images in This Article
Copyright and Terms & Conditions
© 2026. The Author(s). Published by the American Astronomical Society.

