

Image Details
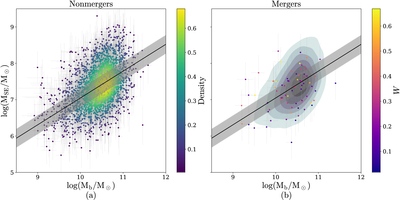
Caption: Figure 2.
Plots showing the best-fit power-law scaling relations between MSE (Equation (3)) and Mb (Table 3). Panel (a) shows the 2219 nonmerging Type 1 AGN hosts. The black line is the best-fit scaling relation (based on the non-merger-only scaling relation in the second row of Table 3), and the color bar is the Gaussian kernel density estimator showing the concentration of points. The gray shaded region is the intrinsic scatter around the scaling relation. Panel (b) shows the 2219 nonmergers as a 2D contour plot in the background, with the same scaling relation as in panel (a) and 75 Type 1 AGN hosts in close pairs in the foreground. The color bar refers to the merger probability of the close pair to which each AGN belongs (Equation (1a)).
Other Images in This Article
Copyright and Terms & Conditions
© 2026. The Author(s). Published by the American Astronomical Society.

