

Image Details
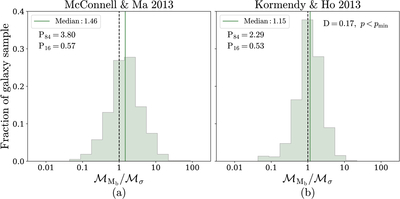
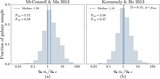
Caption: Figure 7.
Normalized histograms showing the offset between the chirp masses ﹩{ \mathcal M }﹩ (Equation (13)) calculated from M•–Mb and M•–σ (﹩{{ \mathcal M }}_{{M\,}_{\,{\rm{b}}}}/{{ \mathcal M }}_{\sigma }﹩) for individual close galaxy pairs. Panel (a) uses the M•–Mb and M•–σ scaling relations from N. J. McConnell & C.-P. Ma (2013), and panel (b) uses the M•–Mb and M•–σ relations from J. Kormendy & L. C. Ho (2013). The dashed line at 1 indicates perfect agreement, and the solid line indicates the median of the offset distribution. The 16th and 84th percentiles of the distributions are also given, with the K-S test statistic and p-value between the distributions in panels (a) and (b) shown in the upper-right corner of panel (b). The M•–Mb scaling relations predict higher chirp masses compared to M•–σ.
Other Images in This Article
Copyright and Terms & Conditions
© 2026. The Author(s). Published by the American Astronomical Society.

