

Image Details
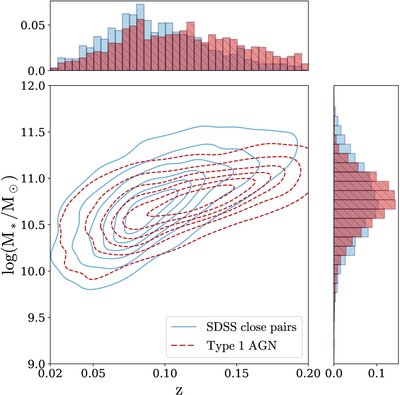
Caption: Figure 1.
Total galaxy stellar mass (M*) versus redshift distribution for the galaxy close pairs, in light blue solid contours and histograms (Section 2.1.2), and Type 1 broad-line AGN hosts, in dark red dashed contours and hatched histograms (H.-Y. Liu et al. 2019; see Section 2.1.3). This plot shows only the galaxies from each parent sample that pass the cuts described in Section 2 (see Tables 1 and 2). The contours show the joint ﹩\mathrm{log}({\,M}_{* }/{M\,}_{\odot })﹩–z distribution, the top panel shows the z distribution, and the right panel shows the ﹩\mathrm{log}({\,M}_{* }/{M\,}_{\odot })﹩ distribution. From this figure, we can see substantial overlap between the total mass and redshift ranges of both samples, with the close pairs shifted toward lower redshifts and extending over a larger total mass range than the Type 1 AGN.
Other Images in This Article
Copyright and Terms & Conditions
© 2026. The Author(s). Published by the American Astronomical Society.

