

Image Details
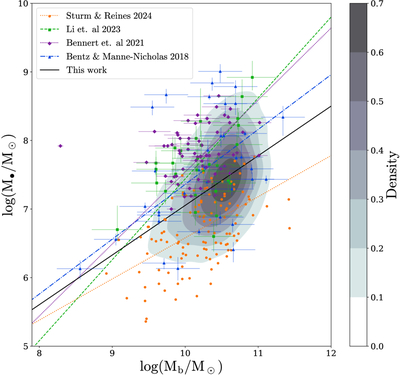
Caption: Figure 3.
Comparison between our best-fit power-law scaling relation between MSE and Mb (mergers+nonmergers; first row of Table 3) and previously published M•–Mb scaling relations from AGN broad lines and photometric bulge masses. Our sample of 2219 Type 1 AGN is plotted as 2D contours corresponding to the Gaussian kernel density of the points, and our scaling relation is shown as the black line. The data points and scaling relations of M. C. Bentz & E. Manne-Nicholas (2018; blue triangles), V. N. Bennert et al. (2021; purple diamonds), J. I.-H. Li et al. (2023; green squares), and M. R. Sturm & A. E. Reines (2024; orange circles) are shown for comparison. Descriptions of each sample and scaling relation parameters are given in Table 3. The SMBH masses in this work are less massive relative to all published scaling relations, aside from that of M. R. Sturm & A. E. Reines (2024).
Other Images in This Article
Copyright and Terms & Conditions
© 2026. The Author(s). Published by the American Astronomical Society.

