

Image Details
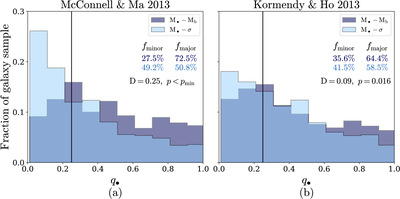
Caption: Figure 5.
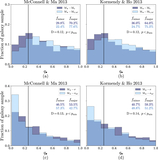
Normalized histograms showing the distribution of SMBH mass ratio q• (Equation (12)) calculated from M•–σ (light blue) and M•–Mb (dark blue). Panel (a) uses the M•–Mb and M•–σ from N. J. McConnell & C.-P. Ma (2013), and panel (b) uses the M•–Mb and M•–σ from J. Kormendy & L. C. Ho (2013). The solid black line at q• = 0.25 divides major and minor SMBH mergers, and the relative fractions of major (fmajor) and minor (fminor) SMBH mergers predicted by each scaling relation are shown as percentages of the total close-pair sample. The Kolmogorov–Smirnov (K-S) statistic (D) between the distributions and the associated p-values are also shown. D is greater in panel (a), indicating a larger statistical difference in the q• distributions obtained from the N. J. McConnell & C.-P. Ma (2013) scaling relations (likely as a result of the differences in morphology and M• dynamic range described in Section 2.4). The M•–Mb scaling relations predict a greater fraction of major SMBH pairs than the M•–σ scaling relations.
Other Images in This Article
Copyright and Terms & Conditions
© 2026. The Author(s). Published by the American Astronomical Society.

