

Image Details
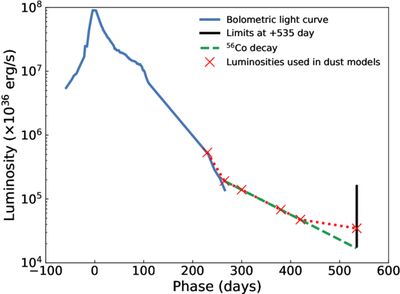
Caption: Figure 7.
The observed bolometric light curve of SN 2018bsz and late-time extrapolations. Since we only detect SN 2018bsz in the MIR at +535 days, we must estimate the true bolometric luminosity that serves as input to our dust models. The lower limit on the late-time luminosity (lower edge of the black vertical line) comes from the requirement that the modeled dust mass does not decrease from previous epochs. The upper limit (upper edge of the black vertical line) comes from the most luminous 5000 K blackbody fit, which matches the MIR points. The green dashed line shows the 56Co decay, while the orange points show the final luminosities that we use in our dust modeling.
Other Images in This Article
Show More
Copyright and Terms & Conditions
© 2026. The Author(s). Published by the American Astronomical Society.

