

Image Details
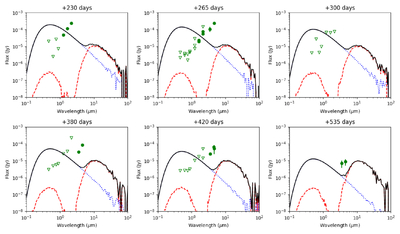
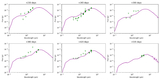
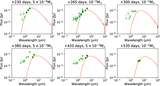
Caption: Figure 4.
The temporal evolution of the emission from a sheet of ISM dust. The predicted SED consists of optical scattered light and the IR echo from dust illuminated by the SN light (red dashed line) and the undelayed emission from the SN (blue dotted line). The IR flux from this assumed ISM is orders of magnitude below the observations, and its flux is quite constant over time. The symbols are the same as those used in Figure 3. The assumed dust model is described in Section 4.1.
Other Images in This Article
Show More
Copyright and Terms & Conditions
© 2026. The Author(s). Published by the American Astronomical Society.

Copyright ©
2026 Astronomy Image Explorer. All Rights Reserved.
