

Image Details
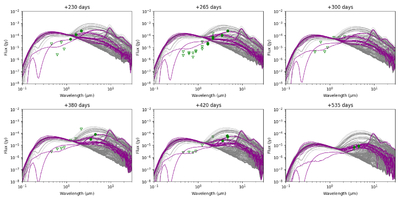
Caption: Figure 5.
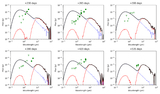
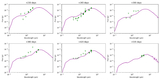
Echo SED calculated from a grid of circumstellar shells. 360 models are shown on each panel, covering 40 different shell geometries, three grain sizes, and two compositions (silicate and carbon dust; the difference is particularly evident in the silicate bump at 10 μm). Models which reproduce the NIR/MIR fluxes at +535 days are plotted in magenta; other models are plotted in gray. It can be seen that no model satisfies the observed optical 3σ upper limits at early epochs. The best-fitting model from this grid is shown in Figure 6, which continues this figure by presenting the predicted SED evolution. The symbols are the same as those used in Figure 3.
Other Images in This Article
Show More
Copyright and Terms & Conditions
© 2026. The Author(s). Published by the American Astronomical Society.

