

Image Details
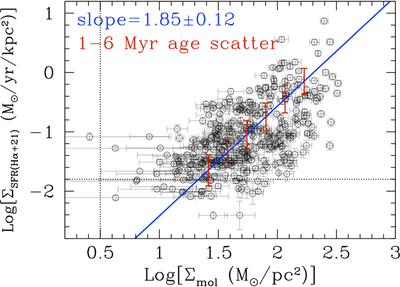
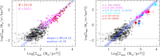
Caption: Figure 9.
The effects of age variations, between 1 Myr and 6 Myr (vertical dark-red bars), on ΣSFR for our regions, shown as a function of ΣSFR for the same bins as the left-hand side; the vertical bars are centered on the mean ΣSFR–Σmol relation (blue line). The variations in ΣSFR range from 0.52 dex at the low end to 0.44 dex at the high end, mirroring the increase in the contribution of the 21 μm emission to the SFR budget from low to high ΣSFR.
Other Images in This Article

Show More
Copyright and Terms & Conditions
© 2026. The Author(s). Published by the American Astronomical Society.

Copyright ©
2026 Astronomy Image Explorer. All Rights Reserved.
