

Image Details
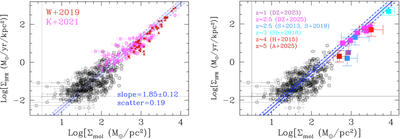
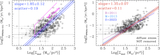
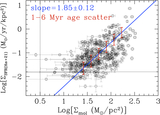
Caption: Figure 10.
(Left) The molecular SF law of the local H II regions in comparison with that of local infrared-bright starbursts (U/LIRGs, magenta squares, R. C. Kennicutt & M. A. C. De Los Reyes 2021) and ∼400–500 pc regions in a few local U/LIRGs (dark-red triangles, C. D. Wilson et al. 2019). The blue line and shaded region are the best fit for the H II regions (see Figure 5, left). (Right) The molecular SF law of the local H II regions in comparison with that of the average values of resolved regions at redshifts z ∼ 1 (M. Messa et al. 2022; M. Dessauges-Zavadsky et al. 2023, purple square), z ∼ 3 (P. Sharda et al. 2018, cyan square), z ∼ 4 (J. A. Hodge et al. 2015, red square), and z ∼ 5 (dark-red square, C. Accard et al. 2025) and that of a few starburst galaxies at z ∼ 2.5 (blue and magenta squares with uncertainties, C. E. Sharon et al. 2013, 2019; M. Dessauges-Zavadsky et al. 2025). The z ∼ 1 point is shown as a lower limit as some star-forming regions are unresolved (M. Messa et al. 2022). The blue lines and shaded area are the best fit from Figure 5, left.
Other Images in This Article

Show More
Copyright and Terms & Conditions
© 2026. The Author(s). Published by the American Astronomical Society.

