

Image Details
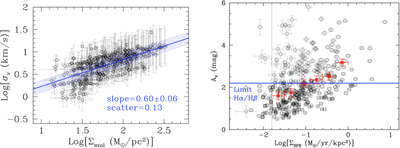
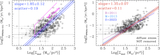
Caption: Figure 8.
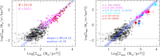
(Left) The distribution of dispersion velocities for the H II regions with Σmol ≥ 10 M⊙ pc−2 in the three galaxies, with the best fit shown together with its scatter (blue line and blue shaded region). The values of the best-fit slope and scatter are given in the panel. (Right) The V-band attenuation AV, calculated from the 21 μm/Hα ratio, as a function of ΣSFR, for all sources in our sample (black circles) with 1σ uncertainties. The binned averages for data above the stochastic sampling limit (vertical dotted line) are shown as red filled squares with uncertainties. The value of AV above which the Hβ recombination line is suppressed by more than 1 order of magnitude is marked by a blue horizontal line.
Other Images in This Article

Show More
Copyright and Terms & Conditions
© 2026. The Author(s). Published by the American Astronomical Society.

