

Image Details
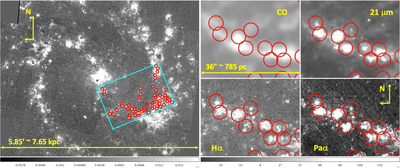
Caption: Figure 1.
(Left) The stellar-continuum-subtracted HST/WFC3/Hα image of NGC 5236, showing the footprint of the JWST/MIRI/21 μm image (cyan rectangle) with the 56 selected regions (red circles). The circles have the same radius as those used for the photometric measurements (2﹩\mathop{.}\limits^{^{\prime\prime} }﹩6). North is up, east is left. (Right) A detail of NGC 5236, shown in the four bands used in this work (clockwise from the top left): CO(2–1), MIRI/21 μm, NIRCam/Paα, and WFC3/Hα. The location of several regions is shown with red circles, highlighting the offsets between the Hα/Paα/21 μm peaks and the CO peaks.
Other Images in This Article

Show More
Copyright and Terms & Conditions
© 2026. The Author(s). Published by the American Astronomical Society.

