

Image Details
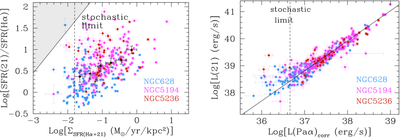
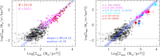
Caption: Figure 4.
(Left) The 21 μm/Hα SFR ratio as a function of the SFR(21+Hα) surface density for the star-forming regions in the three galaxies (teal = NGC 628, magenta = NGC 5194, dark red = NGC 5236) with 1σ uncertainties. The stochastic sampling limit in ΣSFR is marked with a dashed vertical line. The shaded area marks the 3σ detection limit based on the average depth of the images for the three galaxies. The binned averages for data above the stochastic sampling limit are shown as black filled circles with uncertainties calculated as the rms of the uncertainties of the data in each bin. (Right) The 21 μm luminosity of the star-forming regions as a function of the dust-attenuation-corrected Paα luminosity, with the best fit for data above the stochastic sampling limit shown as a solid back line.
Other Images in This Article

Show More
Copyright and Terms & Conditions
© 2026. The Author(s). Published by the American Astronomical Society.

