

Image Details
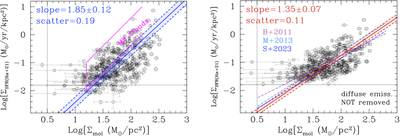
Caption: Figure 5.
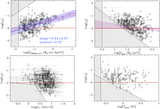
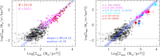
(Left) The SFR surface density as a function of the molecular gas surface density for the 353 regions in our sample (black circles with 1σ uncertainties) together with the best fit through the data returned by the LINMIX algorithm (blue lines with shaded area showing the scatter; B. C. Kelly 2007). Only regions to the top right of the two dotted lines are used in the fits. The approximate locus occupied by the molecular clouds in the Milky Way (e.g., N. J. Evans et al. 2009; A. Heiderman et al. 2010; R. A. Gutermuth et al. 2011; C. J. Lada et al. 2013; S. Willis et al. 2015; Q. Nguyen-Luong et al. 2016; C. J. Lada et al. 2017; R. Retes-Romero et al. 2017; R. Pokhrel et al. 2020) is also shown as a magenta outline for reference. (Right) The same as the left panel, but without removing the underlying diffuse emission from both the SFR and the molecular gas tracers. The best fit, also from the LINMIX algorithm, is shown as the dark-red line with a shaded area. The fits through ∼0.8–1.5 kpc regions in samples of nearby galaxies derived by F. Bigiel et al. (2011, B+2011, purple line), R. Momose et al. (2013, M+2013, teal line), and J. Sun et al. (2023, S+2023, blue line) without removing the diffuse emission are shown for comparison.
Other Images in This Article

Show More
Copyright and Terms & Conditions
© 2026. The Author(s). Published by the American Astronomical Society.

