

Image Details
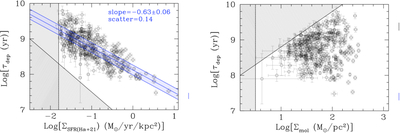
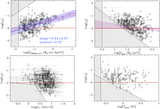
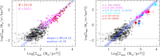
Caption: Figure 7.
The molecular gas depletion timescale, τdep, for the regions in our sample as a function of ΣSFR (left) and Σmol (right). The areas excluded by the limits Log(ΣSFR)≥ −1.8 and Log(Σmol) ≥ 0.5 are marked as black lines with gray shaded regions. For the τdep versus ΣSFR plot, the best-fit line (blue solid) with its scatter (shaded blue) is also shown.
Other Images in This Article

Show More
Copyright and Terms & Conditions
© 2026. The Author(s). Published by the American Astronomical Society.

Copyright ©
2026 Astronomy Image Explorer. All Rights Reserved.
