

Image Details
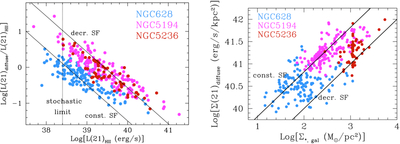
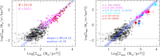
Caption: Figure 3.
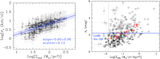
(Left) The ratio of diffuse-to-H II region emission at 21 μm for the star-forming regions in the three galaxies, shown in different color symbols for the different galaxies (teal = NGC 628; magenta = NGC 5194; dark red = NGC 5236). The stochastic sampling limit (the stochastic limit in the figure) is marked as a vertical dotted black line. The solid black lines mark the trends expected by models in the case of (lower line) constant SF and (upper line) decreasing SF over the past few Gyr, with the latter mimicking the SFH of NGC 5194 (E. E. Martínez-García et al. 2018); see the text and Appendix B for more details on the models. The y ∼ −x trend in log–log scale is expected for roughly constant diffuse emission independent of H II region luminosity. (Right) The diffuse 21 μm surface density as a function of the stellar mass surface density of the underlying galaxy for all three galaxies. The same models as those in the left panel are shown (black solid lines).
Other Images in This Article

Show More
Copyright and Terms & Conditions
© 2026. The Author(s). Published by the American Astronomical Society.

