

Image Details
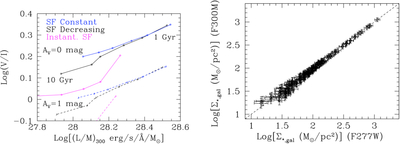
Caption: Figure 14.
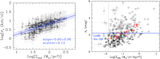
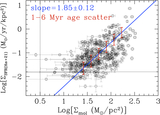
(Left) V − I color versus 3 μm luminosity-to-mass ratio for population models with the following SFHs: constant SF (blue curves), exponentially decreasing SF with 4.3 Gyr e-folding time (black curves) and instantaneous burst (magenta curves). The models are shown for the two cases of AV = 0 mag (continuous lines) and AV = 1 mag (dashed lines), between ages 1 Gyr and 10 Gyr. While the change in attenuation has a large impact on the V − I color, it has minimal impact on the 3 μm luminosity-to-mass ratio. (Right) The mass surface densities of the stellar populations underlying the star-forming regions in NGC 628, derived from measurements in F277W and F300M, are compared with each other.
Other Images in This Article

Show More
Copyright and Terms & Conditions
© 2026. The Author(s). Published by the American Astronomical Society.

