

Image Details
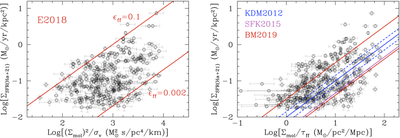
Caption: Figure 12.
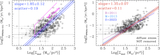
The SFR surface density as a function of the molecular gas surface density per freefall time for our star-forming regions (black circles with 1σ uncertainties) is compared with additional models from the literature. By construction, the models shown in both panels have slope = 1. (Left) The “local” model of B. G. Elmegreen (2018) (dark-red solid lines), which leaves the efficiency ϵff as a free parameter, adjusted to encompass the data as shown in the figure. (Right) The “local” single-freefall model of M. R. Krumholz et al. (2012, KDM+2012) is shown for ϵff = 0.01 (blue solid line) together with a scatter of ±0.15 dex (blue dashed lines) about the mean ϵff value, as predicted by M. R. Krumholz & C. F. McKee (2020). The “local” model of B. Burkhart & P. Mocz (2019), which adds a power-law tail to the density PDF of the gas, is shown for two choices of the sonic Mach number Ms and the turbulence forcing parameter b (dark-red solid lines), for exponent α = 2 of the power law: top-left line for Ms = 20 and b = 0.3 and bottom-right line for Ms = 50 and b = 0.7. The prediction from the model of D. M. Salim et al. (2015, SFK2015), already introduced in Figure 11, is also shown (purple solid line).
Other Images in This Article

Show More
Copyright and Terms & Conditions
© 2026. The Author(s). Published by the American Astronomical Society.

