

Image Details
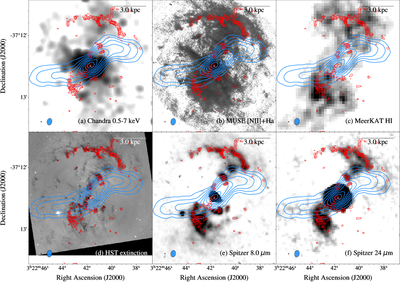
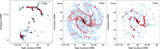
Caption: Figure 15.
Comparison of ALMA CO(J = 1–0) integrated intensity (red solid contours) with multiwavelength observations (gray scale). The S-shaped nuclear jet observed with MeerKAT at 1.4 GHz is indicated by blue solid contours in all panels. The filled ellipses at the bottom left of each panel represent the restoring beams for the CO (red) and jet (blue) observations, both outlined with black edges. The gray-scale images are the (a) Chandra X-ray map, (b) MUSE Hα + [N II] map, (c) MeerKAT H I map, (d) HST extinction map, (e) stellar-subtracted Spitzer 8.0 μm map, and (f) stellar-subtracted Spitzer 24 μm map.
Other Images in This Article
Show More
Copyright and Terms & Conditions
© 2026. The Author(s). Published by the American Astronomical Society.

