

Image Details
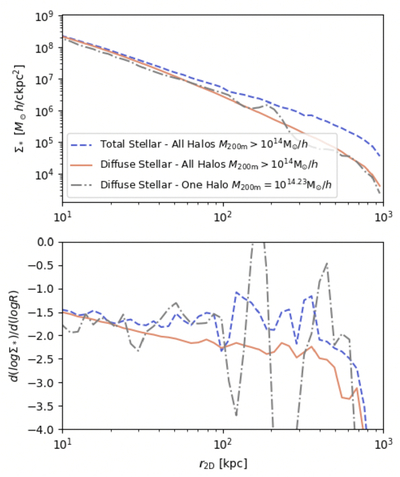
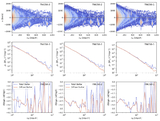
Caption: Figure 8.
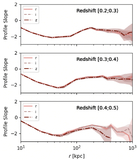
Upper panel: stacked stellar density profiles of galaxy cluster-sized halos in the TNG300-1 simulation, projected onto the X–Y plane. We show the total stellar density profiles and the diffuse component. The diffuse stellar density profiles are smoother than the total stellar profile. Lower panel: radial slope profiles of the diffuse stellar component and the total stellar component of the clusters. While the slope of the diffuse stellar component becomes steeper with increasing radius, we do not observe a notable dip feature, unlike our measurements with the data. We also examine the profiles of one single halo in TNG300-1 with mass (M200 ∼ 1014.23 M⊙ h−1) comparable to the TNG50-1 simulation, shown as the dotted–dashed lines in both panels, which similarly show a relatively flat diffuse profile with no prominent dip (other than measurement noises).
Other Images in This Article
Copyright and Terms & Conditions
© 2026. The Author(s). Published by the American Astronomical Society.

