

Image Details
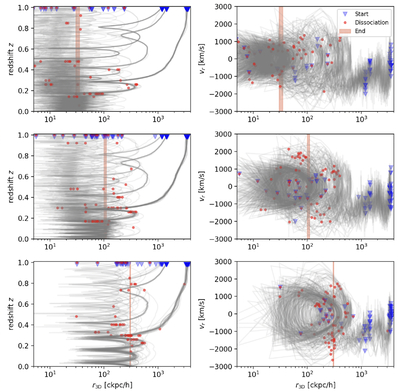
Caption: Figure 6.
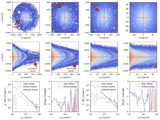
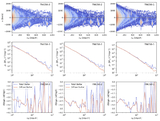
Evolution history of the stellar particles in the TNG50-1 simulation. Top row: the history of a sample of diffuse stellar particles in the radial range [30, 35] ckpc h−1 at z = 0. The upper left panel shows the evolution of their radial distances to the cluster center. Some of the particles have settled into close orbits as early as z = 1. Others started as far away as >3000 ckpc h−1. The upper right panel shows the evolution of the particles’ phase-space diagram. The particles that traveled great radial distances from z = 1 to z = 0 tend to start on an accretion streak with negative radial velocities, then make a couple of orbits at an intermediate distance with high radial velocities, and finally settle into an orbit close to the cluster center. The blue triangles and pink bands respectively mark the particles’ initial locations at z = 1 and final locations at z = 0. The orange circles mark the approximate locations where they become dissociated from a subhalo (outside three times SubhaloHalfmassRad of subhalos), or their initial locations if they are already dissociated at redshift z = 1.0. Middle and bottom rows: same plots but for diffuse stellar particles in the radial ranges [100, 110] ckpc h−1 and [300, 310] ckpc h−1 at redshift 0. Their evolution shows similar trends to the diffuse stellar particles in the radial range [30, 35] ckpc h−1. The bottom panels also contain particles with high angular momentum, whose orbits do not plunge to small radii.
Other Images in This Article
Copyright and Terms & Conditions
© 2026. The Author(s). Published by the American Astronomical Society.

