

Image Details
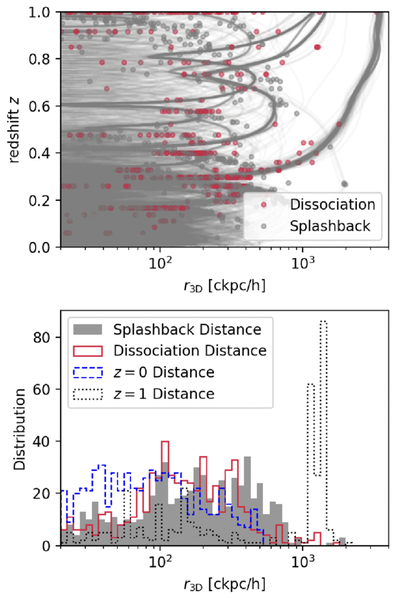
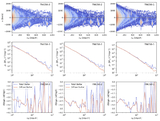
Caption: Figure 7.
Evolution history of a random sample of stellar particles with their z = 0 distances between 20 and 500 ckpc h−1 in the TNG50-1 simulation. Upper panel: the particles’ radial distances to the cluster center versus redshift, noting where they become dissociated from subhalos, as well as their splashback distances (the furthest distances they reach during their first orbit) after dissociation. Lower panel: distributions of the particles’ dissociation distances, splashback distances, as well as their z = 0 and z = 1.0 distances. The particle’s dissociation and splashback distances first peak around 100 ckpc h−1.
Other Images in This Article
Copyright and Terms & Conditions
© 2026. The Author(s). Published by the American Astronomical Society.

