

Image Details
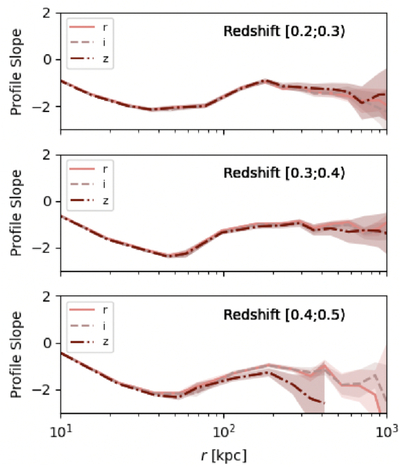
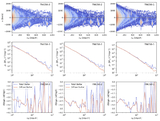
Caption: Figure 4.
Slope profiles of redMaPPer clusters with surface brightness measurements in different optical bands, r, i, and z. The slope measurements within 200 kpc and the dip locations are highly consistent among measurements in different bands.
Other Images in This Article
Copyright and Terms & Conditions
© 2026. The Author(s). Published by the American Astronomical Society.

Copyright ©
2026 Astronomy Image Explorer. All Rights Reserved.
