

Image Details
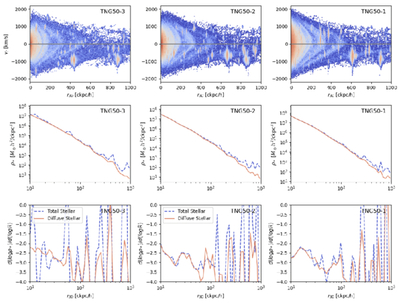
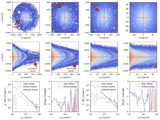
Caption: Figure 9.
Top row: phase-space diagram (radial velocity versus radial distance) of the cluster (diffuse and subhalo) stellar particles in TNG50-3, TNG50-2, and TNG50-1 with increasing resolution from left to right. The shell-like structures are most prominent and “sharp” (with clear edges) in the simulation with the highest resolution, TNG50-1. Middle row: 3D density profiles of the cluster stellar contents. Bottom row: the radial slopes of the 3D density profiles. Density transition features are most evident in the simulation with the highest resolution, TNG50-1, but more difficult to see in the TNG50-3 simulation.
Other Images in This Article
Copyright and Terms & Conditions
© 2026. The Author(s). Published by the American Astronomical Society.

