

Image Details
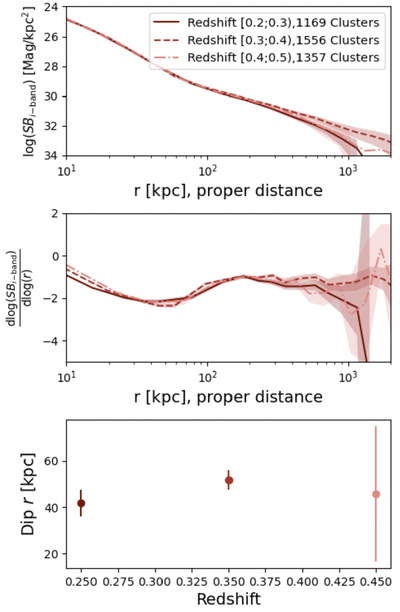
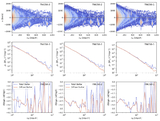
Caption: Figure 1.
Top: surface brightness profiles of redMaPPer clusters in three redshift bins. These profiles were presented by Y. Zhang et al. (2024), each consisting of over 1000 stacked clusters. Middle: derived slopes of the surface brightness profiles in different redshift bins. Note the dip feature between 20 and 100 kpc in all of the profiles at the CG outskirts. Bottom: the local minima of the dips are identified to be between 42 and 52 kpc and do not seem to have significant dependence on cluster redshift.
Other Images in This Article
Copyright and Terms & Conditions
© 2026. The Author(s). Published by the American Astronomical Society.

Copyright ©
2026 Astronomy Image Explorer. All Rights Reserved.
